
Blood Report Decoder: Understand All 20 Blood Test Values Instantly
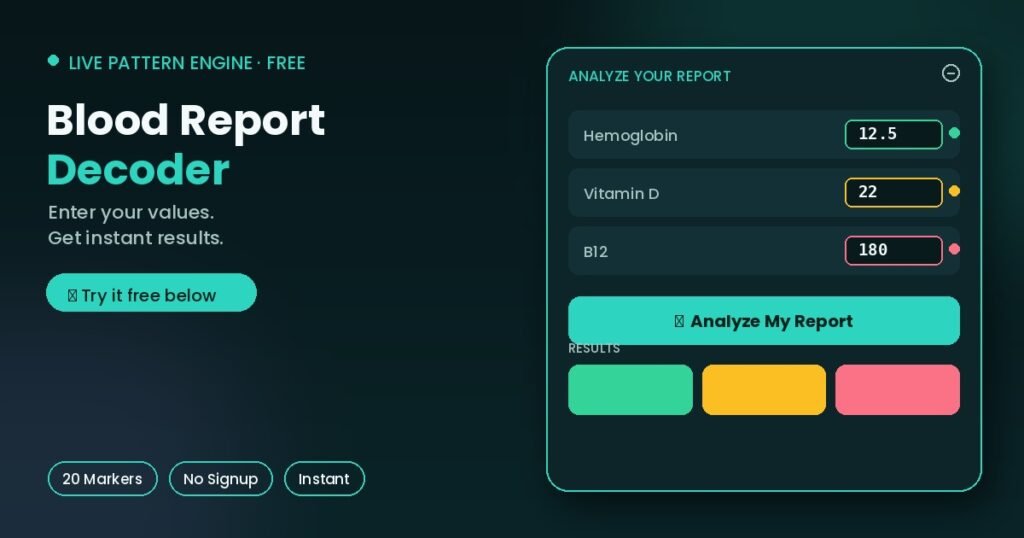
Enter whatever values your blood report has and get an instant, color-coded, pattern-based breakdown — built by a pharmacist, not a generic calculator.
Analyze Your Blood Report
Fill in whatever your report includes — every field is optional
Complete Blood Count
Carries oxygen in your blood. Low levels are the classic sign of anemia — the exact cause (iron, B12, or something else) depends on other markers here too.
White blood cells fight infection. High levels often mean your body is actively fighting something; low levels can mean reduced immune defense.
Involved in blood clotting. Both very low and very high levels are worth a doctor’s attention.
Average size of your red blood cells. This one detail, combined with hemoglobin, helps tell iron deficiency and B12 deficiency apart.
Vitamins & Minerals
Essential for nerve function and red blood cells. Especially important to check for vegetarians. Full B12 guide →
Affects bones, immunity, mood, and hair. Extremely common gap in India despite abundant sunlight. Full Vitamin D guide →
Your iron reserves. Can be low even when hemoglobin still looks normal — an early warning sign.
Involved in over 300 body processes, including activating vitamin D. Full Magnesium guide →
Works closely with vitamin D for bone health. Usually checked together.
Thyroid
Controls thyroid hormone production. High TSH usually means an underactive thyroid; low TSH usually means an overactive one.
Blood Sugar
Measured after 8+ hours without eating. Repeated high readings are how prediabetes and diabetes get identified.
Your average blood sugar over the past 2–3 months — more reliable than a single fasting reading.
Lipid Profile
Combines LDL, HDL, and other fats. Usually interpreted alongside the individual values below, not alone.
Higher levels are linked to plaque buildup in arteries over time.
Unlike other markers here, higher HDL is generally better — it helps clear cholesterol from your blood.
A type of fat strongly influenced by sugar, alcohol, and refined carbs in the diet.
Kidney, Liver & Uric Acid
A waste product filtered by your kidneys. Elevated levels can indicate reduced kidney function.
High levels are linked to gout and kidney stones. Full Uric Acid guide →
A liver enzyme. Elevated levels can point to liver strain from various causes, including diet and alcohol.
Another liver enzyme, usually interpreted together with SGPT rather than alone.
Important
This tool is educational and does not diagnose anything. It’s designed to help you understand your report and know what’s worth discussing with a doctor — not to replace that conversation.

Most blood report tools online check one number at a time — a uric acid calculator here, a BMI tool there. This Blood Report Decoder is built differently: it looks at your full report, up to 20 common markers at once, the way a doctor actually reads one — not number by number, but as a connected picture. Enter whatever your report includes, and get an instant breakdown of what’s normal, what’s borderline, what’s flagged, and — more usefully — which combinations of results actually point toward something specific. This Blood Report Decoder is free to use as often as you’d like.
How Your Blood Report Actually Works
A single number rarely tells the full story. A slightly low hemoglobin means something different depending on whether your ferritin is also low, or your MCV is high, or both are normal. Doctors read reports as a connected picture, not a checklist of isolated numbers — and this tool is built to do the same thing.
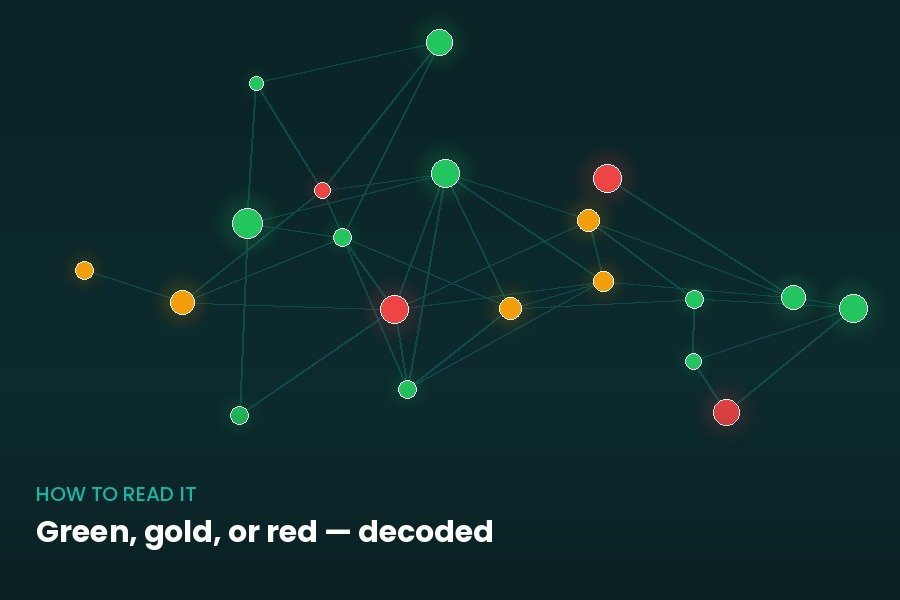
Most online calculators check exactly one marker against a fixed range and stop there. That approach misses the combinations that actually explain why a number is off, which is usually the more useful question than simply “is this normal or not.”
This decoder evaluates each value you enter against reference ranges adjusted for your sex and age, then separately checks specific combinations of markers against each other — the same logic a clinician applies when reviewing a full panel.
Think of it like reading a weather map instead of a single thermometer. One temperature reading tells you something, but a map showing pressure, humidity, and wind together tells you whether a storm is actually forming. Your blood report works the same way — individual numbers matter, but the pattern across them tells the more complete story.
For a general clinical reference on what a complete blood count actually measures, the National Institutes of Health’s MedlinePlus entry on CBC tests is a solid, freely available resource.
Understanding the Colors
Green (Normal) means the value falls within the typical healthy range for your sex and age.
Gold (Borderline) means the value is outside the ideal range but not dramatically so — generally worth monitoring rather than panicking about.
Red (Flagged) means the value is meaningfully outside the expected range and worth a conversation with a doctor.
Flagged results are further split into two urgency levels: “Monitor” for values that are elevated but not urgent, and “See a doctor soon” for values significantly outside range or combined with other flagged markers in a recognizable pattern. This distinction matters — treating every flag as equally urgent isn’t accurate and isn’t helpful.
This two-tier approach also protects against a common problem with generic health calculators: alarm fatigue. If every mildly off number gets the same red, urgent-sounding warning, people either panic unnecessarily or, worse, start ignoring flags altogether after a few false alarms. Separating “worth watching” from “worth calling your doctor about today” keeps the tool genuinely useful rather than anxiety-inducing.
The Pattern Engine, Explained
Here are a few examples of what the pattern engine actually looks for, so you understand the logic even before you use the tool:
Low hemoglobin + low ferritin points toward iron-deficiency anemia specifically, rather than anemia from an unclear cause.
Low hemoglobin + high MCV points toward a different mechanism entirely — B12 or folate deficiency, which produces larger, less efficient red blood cells rather than fewer iron-carrying ones.
High fasting sugar + high HbA1c together is a much stronger signal than either alone, since HbA1c confirms the pattern has been present for months, not just on test day.
High triglycerides + low HDL is a recognized metabolic risk combination, more informative than looking at total cholesterol by itself.
Low vitamin D + low magnesium matters because your body needs magnesium to actually activate vitamin D — supplementing one without addressing the other can leave you stuck at low levels despite taking supplements.
None of these patterns are exotic or invented — they’re standard clinical reasoning. What’s unusual is having them checked automatically, instantly, across your whole report at once.
This is also why filling in more fields genuinely improves the tool’s usefulness, even beyond just getting more individual results. Every additional value you add increases the chance the Pattern Engine catches a real combination — a single flagged marker in isolation is a data point, but two or three related markers moving together is a signal worth acting on.
Why Age and Sex Change What’s “Normal”
Hemoglobin, uric acid, and creatinine reference ranges genuinely differ between men and women — a value that’s low for a man can be perfectly normal for a woman, and vice versa. Ignoring this produces results that look scarier or more reassuring than they should.
Age matters too, though less universally. Thyroid reference ranges, for instance, are often interpreted slightly more leniently in adults over 50. This tool adjusts for that specific case rather than pretending every age group should be judged identically.
Who Should Use This Blood Report Decoder
- Anyone who just got a routine blood test back and wants to understand it before their next doctor’s visit.
- People managing a known condition (thyroid, diabetes, high uric acid) who want to track multiple related markers together over time.
- Vegetarians checking B12, ferritin, and vitamin D together, since these commonly overlap.
- Anyone helping an older family member make sense of a report full of unfamiliar abbreviations.
It’s also genuinely useful right before an appointment, not just after one. Running your report through the decoder ahead of time helps you walk in with specific questions — “my ferritin and hemoglobin are both low, should we be looking at iron supplementation?” — rather than a vague “everything okay, doctor?” that doesn’t make the most of a short consultation slot.
Your Privacy: What Happens to Your Data
Every calculation this Blood Report Decoder performs happens directly in your browser using JavaScript. Nothing you type is sent to any server, logged, or stored anywhere by Sehatsphere.
The optional “Save Profile” feature stores your entered values only on your own device’s browser storage, so you can reload them later or compare against a future report. This data never leaves your device and isn’t accessible to us.
What This Tool Can’t Do
It can’t account for medications you’re taking, other conditions you have, or lab-specific reference range variations, all of which can shift how a result should actually be interpreted.
It can’t replace the physical examination, history-taking, and clinical judgment a doctor brings to your specific situation. Use this to understand your report and prepare better questions — not as a final answer.
The Short Version of This Blood Report Decoder
- Enter whatever values your report has across CBC, vitamins, thyroid, sugar, lipids, and kidney/liver markers.
- Results are color-coded (green/gold/red) and adjusted for your sex and age.
- The Pattern Engine checks combinations, not just isolated numbers, the way a doctor actually reads a report.
- Nothing you enter is sent anywhere — all calculations happen in your browser.
- This is an educational starting point, not a diagnosis — always follow up with a doctor on flagged results.
Frequently Asked Questions
Yes, this Blood Report Decoder is completely free, with no signup, no email required, and no limit on how many times you use it.
No. Every calculation happens directly in your browser. Nothing is sent to any server. If you use the optional Save Profile feature, that data stays only on your own device.
No. It’s an educational tool to help you understand your report before a consultation, not a diagnosis. Always discuss results with a qualified doctor.
Normal ranges for several markers, including hemoglobin, uric acid, creatinine, and thyroid, genuinely differ by sex and, in some cases, by age. Skipping this step produces less accurate results.
That’s fine. Every field is optional. Fill in whatever your report includes, and the tool will analyze exactly those values.
It looks at combinations of markers together, the way a doctor would, instead of judging each number in isolation, since certain combinations point toward specific, identifiable causes.
Yes. The Save Profile feature lets you label and store multiple reports, such as separate profiles for different family members, directly in your browser.
Use the unit toggle next to sugar and cholesterol fields to switch between mg/dL and mmol/L before entering your numbers.
Small differences in a single value can shift it from one category to another near a threshold, and different labs occasionally use slightly different reference ranges too. If a result feels borderline either way, that’s exactly the kind of case worth flagging to your doctor rather than settling by tool alone.
Yes, that’s exactly what the Save Profile feature is designed for. Most nutrient and metabolic markers take two to three months to show meaningful change, so retesting around that timeline and comparing against your saved profile gives a more useful picture than testing again too soon.